Contents
- Introduction
- GPR File Formats
- 3D Canvas
- Lighting
- Position
- Filter
- Gain
- Transform
- 3D File Export
- Software Download
- Closing Remarks
Introduction
This software provides 3D views of Ground Penetrating Radar (GPR) data. Since trace data can be spread across multiple files, the viewer can open multiple files, displaying the combined file data in a single 3D view. The close menu item will close all open files together.
The viewer is intended for grid-like parallel traces lines; either in a single file or in multiple files. A 3D view of the subsurface is extracted from these lines. The viewer locates parallel trace lines and attempts to infer points between the lines to render a 3D view of the subsurface. GPR data is first displayed as points, plotting each trace of the subsurface. A set of common transformations can be applied to the data such as de-wow, and gain. Thereafter, the data can be transformed from points to lines. The viewer finds lines that have been exposed by the common transformations on points. With the GPR data as lines, further transformations compose polygons by matching lines from parallel traces; thereby rendering a 3D image of the subsurface. Common graphics operations can then be used to explore the subsurface in 3D.
The 3D image can be exported to a variety of common 3D formats, so that it can be further manipulated by other graphical tools. We use the Open Asset Import Library™ Vilmring 24 23560 Luebeck, Germany, (Assimp) for this purpose. The export file formats supported by Assimp are listed in the Export As menu dialog of the GPR Viewer. More information on Assimp can be found online.
GPR File Formats
The GPR files formats currently supported are:
- Sensors & Software®: dt1, Sensors & Software LLC Mississauga, Canada
- MALA®: rd3, rd7, MALA GPR Australia, Brookvale, Australia
- GSSI®: dzt, Geophysical Survey Systems, Nashua, NH
Along with these files, the viewer requires other files which are needed for 3D rendering, such as GPS data. The GPR Viewer only uses positioning information to form a 3D view of the trace data; exact global location of the positions is ignored in this version of the GPR Viewer.
3D Canvas
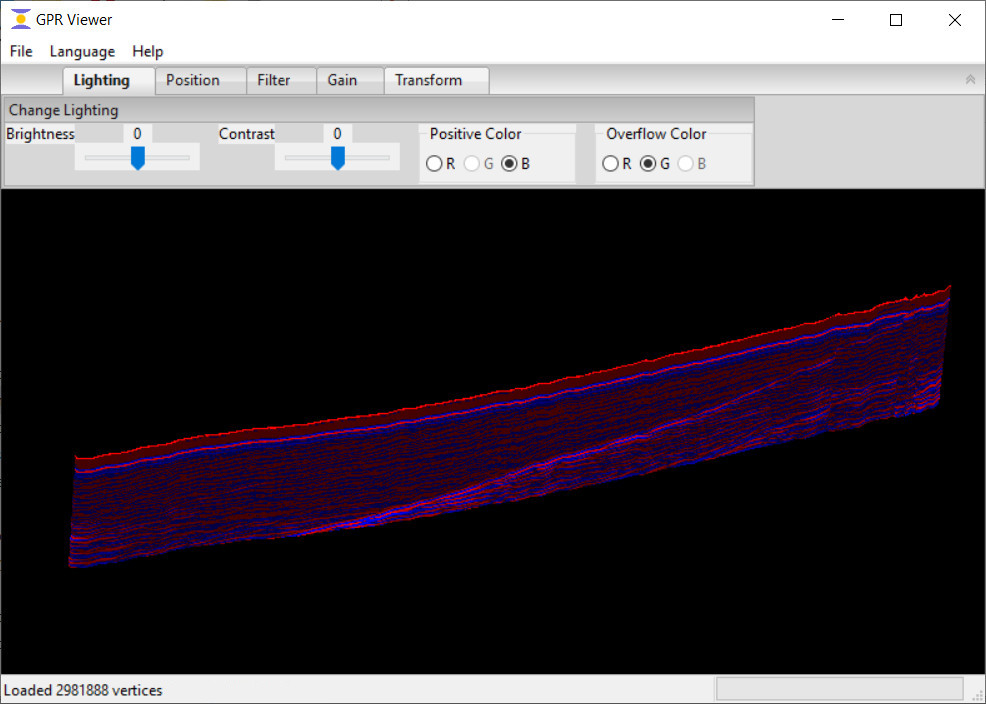
Figure 1 shows the canvas, or main screen, of the GPR Viewer with a trace rendered as point data. The data shown in this and other images is GPR example data available online at https://github.com/NSGeophysics/GPRdata.
The image can be rotated in 3D by left clicking on the screen and dragging the mouse in any direction. The image rendered on the screen will rotate correspondingly.
Lighting
Figure 1 shows the GPR Viewer with the Light tab controls selected. The Brightness and Contrast sliders can be used to increase or decrease the images brightness and contrast respectively. Positive color radio buttons select one among Red, Green, or Blue, to render positive reflections. When setting brightness and contrast values, strong positive reflections may exceed the limit of one color. For this purpose, an overflow color is selected to render strong reflections that exceed this limit. The overflow color is also one among red, green and blue, but cannot be the color chosen for positive reflections. In the figure, the overflow color blue is disabled since it's used for positive reflections. Strong negative reflections are displayed with the remaining color, in Figure 1, it's Red, since both Blue and Green have been selected.
Position
Figure 1 showed the GPR Viewer with the Lighting
tab controls selected.
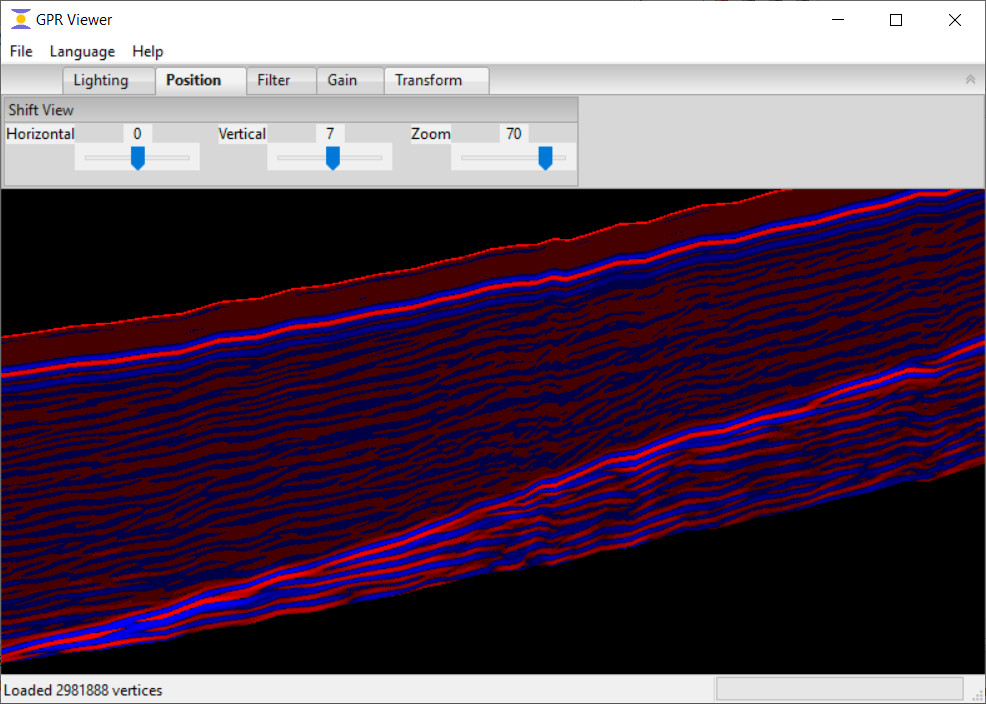
Figure 2 show the same image with the Position tab selected and position sliders
altered. Three sliders are available to modify the image: horizontal, vertical,
and zoom sliders. The horizontal slider moves the image left and right, the
vertical slider moves the image up and down, and the zoom slider magnifies
or reduces the image size. Figure 2 shows the image in Figure 1
with magnification.
Filter
Figure 1 showed the GPR Viewer with the Lighting
tab controls selected.

Figure 3 show the same image with the Filter tab selected and filters applied.
The dcshift filter check box enables or disables the application of the direct current offset
filter to the trace data. This filter uses trace data before time 0 to estimate
the direct current offset which is then removed from the remainder of the trace
data below it. The Time 0 slider is used to set the boundary of time 0 in the data.
It is automatically set if present in the metadata. Dewow removes the low frequency
bias from the trace data using either moving average or moving median. The size of
the moving average/median window is determined by the Window Len slider. The dewow
radio buttons choose among none, moving average, moving window for the application of
the dewow filter. The dewow computation starts at time 0;
both dcshift and dewow computations are tied to the time 0 slider.
Gain
Figure 1 showed the GPR Viewer with the Lighting
tab controls selected.
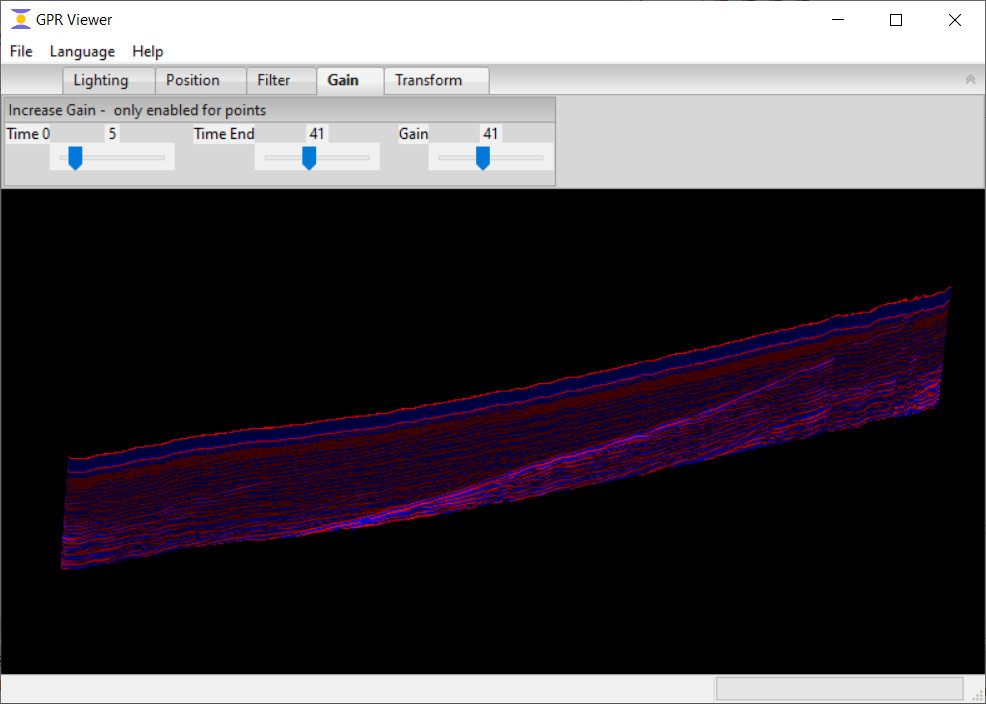
Figure 4 show the same image with the Gain tab selected and gain applied.
Gain is applied to increase the strength of weak reflections that are deep
in the trace data. Gain is applied starting at time 0 and increased to a
maximum depth at time end. The two corresponding sliders, shown in Figure 4,
control these settings. Time 0 is automatically set if present in the metadata.
The amount of gain to apply is controlled by the Gain slider.
Transform
Figure 1 showed the GPR Viewer with the Lighting
tab controls selected.
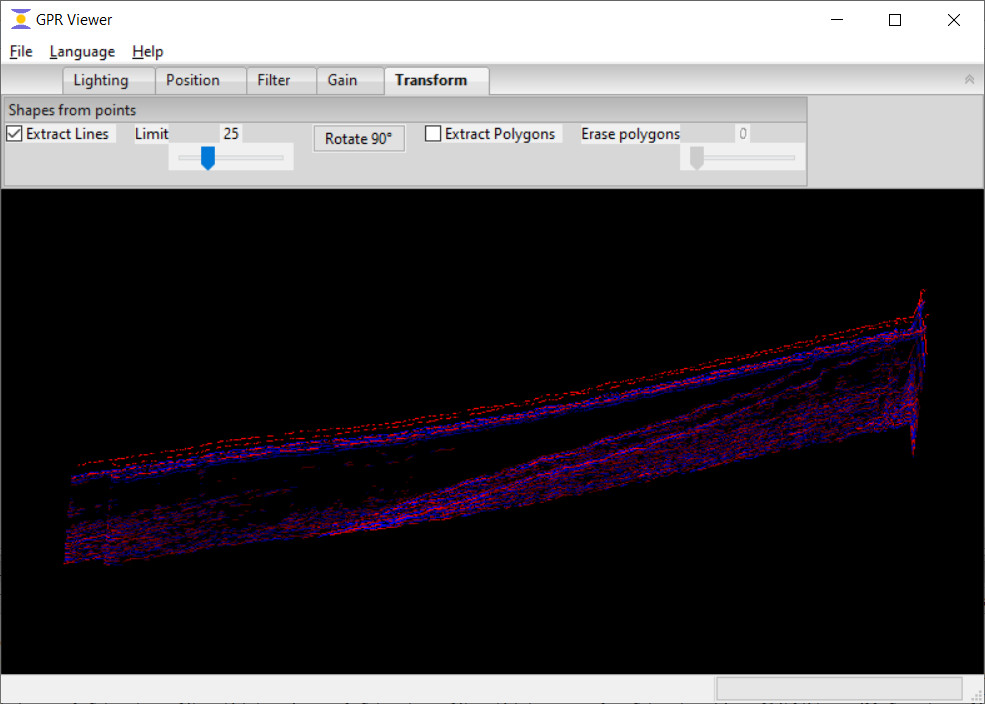
Figure 5 shows the same image with the Transform tab selected and the Extract Lines transformation applied.
The GPR Viewer examines the point data and attempts to locate hyperbolas within it. The hyperbolas
are represented as multi-point graphics lines. The resulting lines
thus formed are sorted in descending order of their lengths. If too many short lines are produced, they
can be eliminated using the Limit slider which retains only a percentage of the lines found; starting
with the longest lines until the percentage is reached.
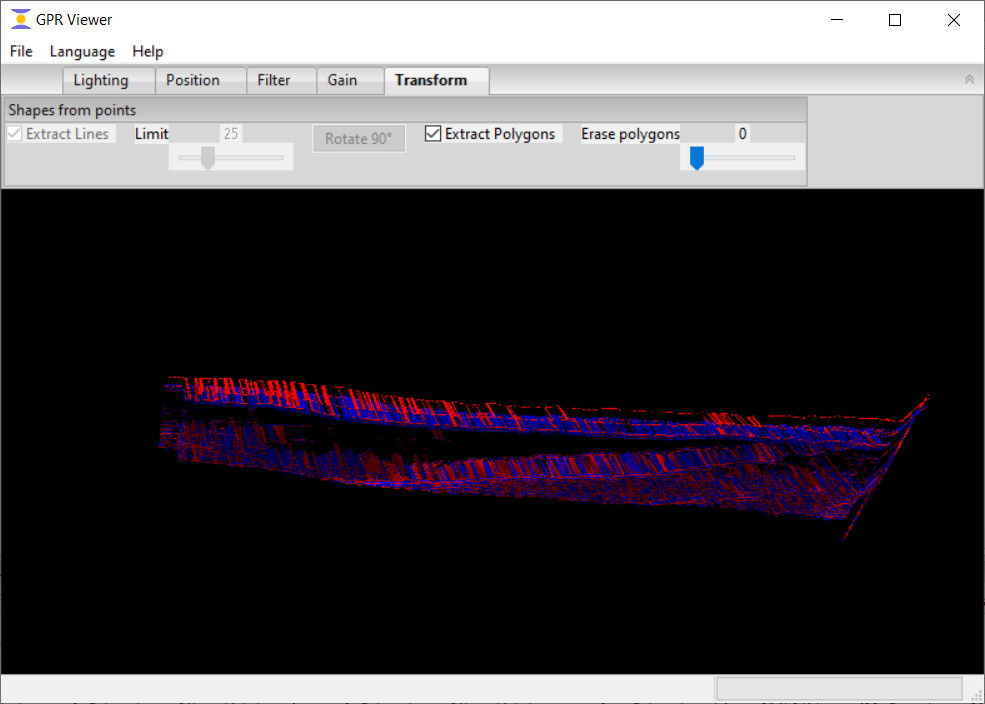
Once lines have been isolated from points, they can be further transformed into polygons by checking
the Extract Polygons checkbox. This feature requires that trace data be organized into mostly horizontal
parallel grids. If instead, traces are vertical, the Rotate 90 degree button shifts their
orientation horizontally. Thereafter, the Extract Polygons checkbox is selected to interpolate
polygons from neighboring parallel lines, thereby creating a 3D image of the sub surface. This is shown in Figure 6.
Overlapping lines at the same depth in neighboring traces are matched, and their overlapping portions
are transformed into polygons. Unmatched portions remain as lines. The Erase Polygons slider is used
to remove top layers to expose lower layers. The removal starts with negative reflections (shown in red)
and continues with positive reflections (shown in blue).
3D File Export
The menu item File → Export As exports the 3D view to another file format; in order to be further manipulated by other 3D tools that accept a specific file format. The export file formats that are supported are in the Save as Type pull down list of the Export menu dialog. We use the Open Asset Import Library™ Vilmring 24 23560 Luebeck, Germany, (Assimp) for this feature. If problems appear with one format, try using another.
Software Download
We request that you contact us to obtain a user login which is required in order to access the download link. The GPR Viewer is presently a Limited Availability Beta. It's only available for 64 bit versions of Windows 11™. We are interested in clients from diverse sectors, academia, and welcome feedback regarding features and function.
Closing Remarks
It is our fond hope that the GPR user community will find this software useful and interesting, and help us target improvements that will enhance its usefulness and usability.
